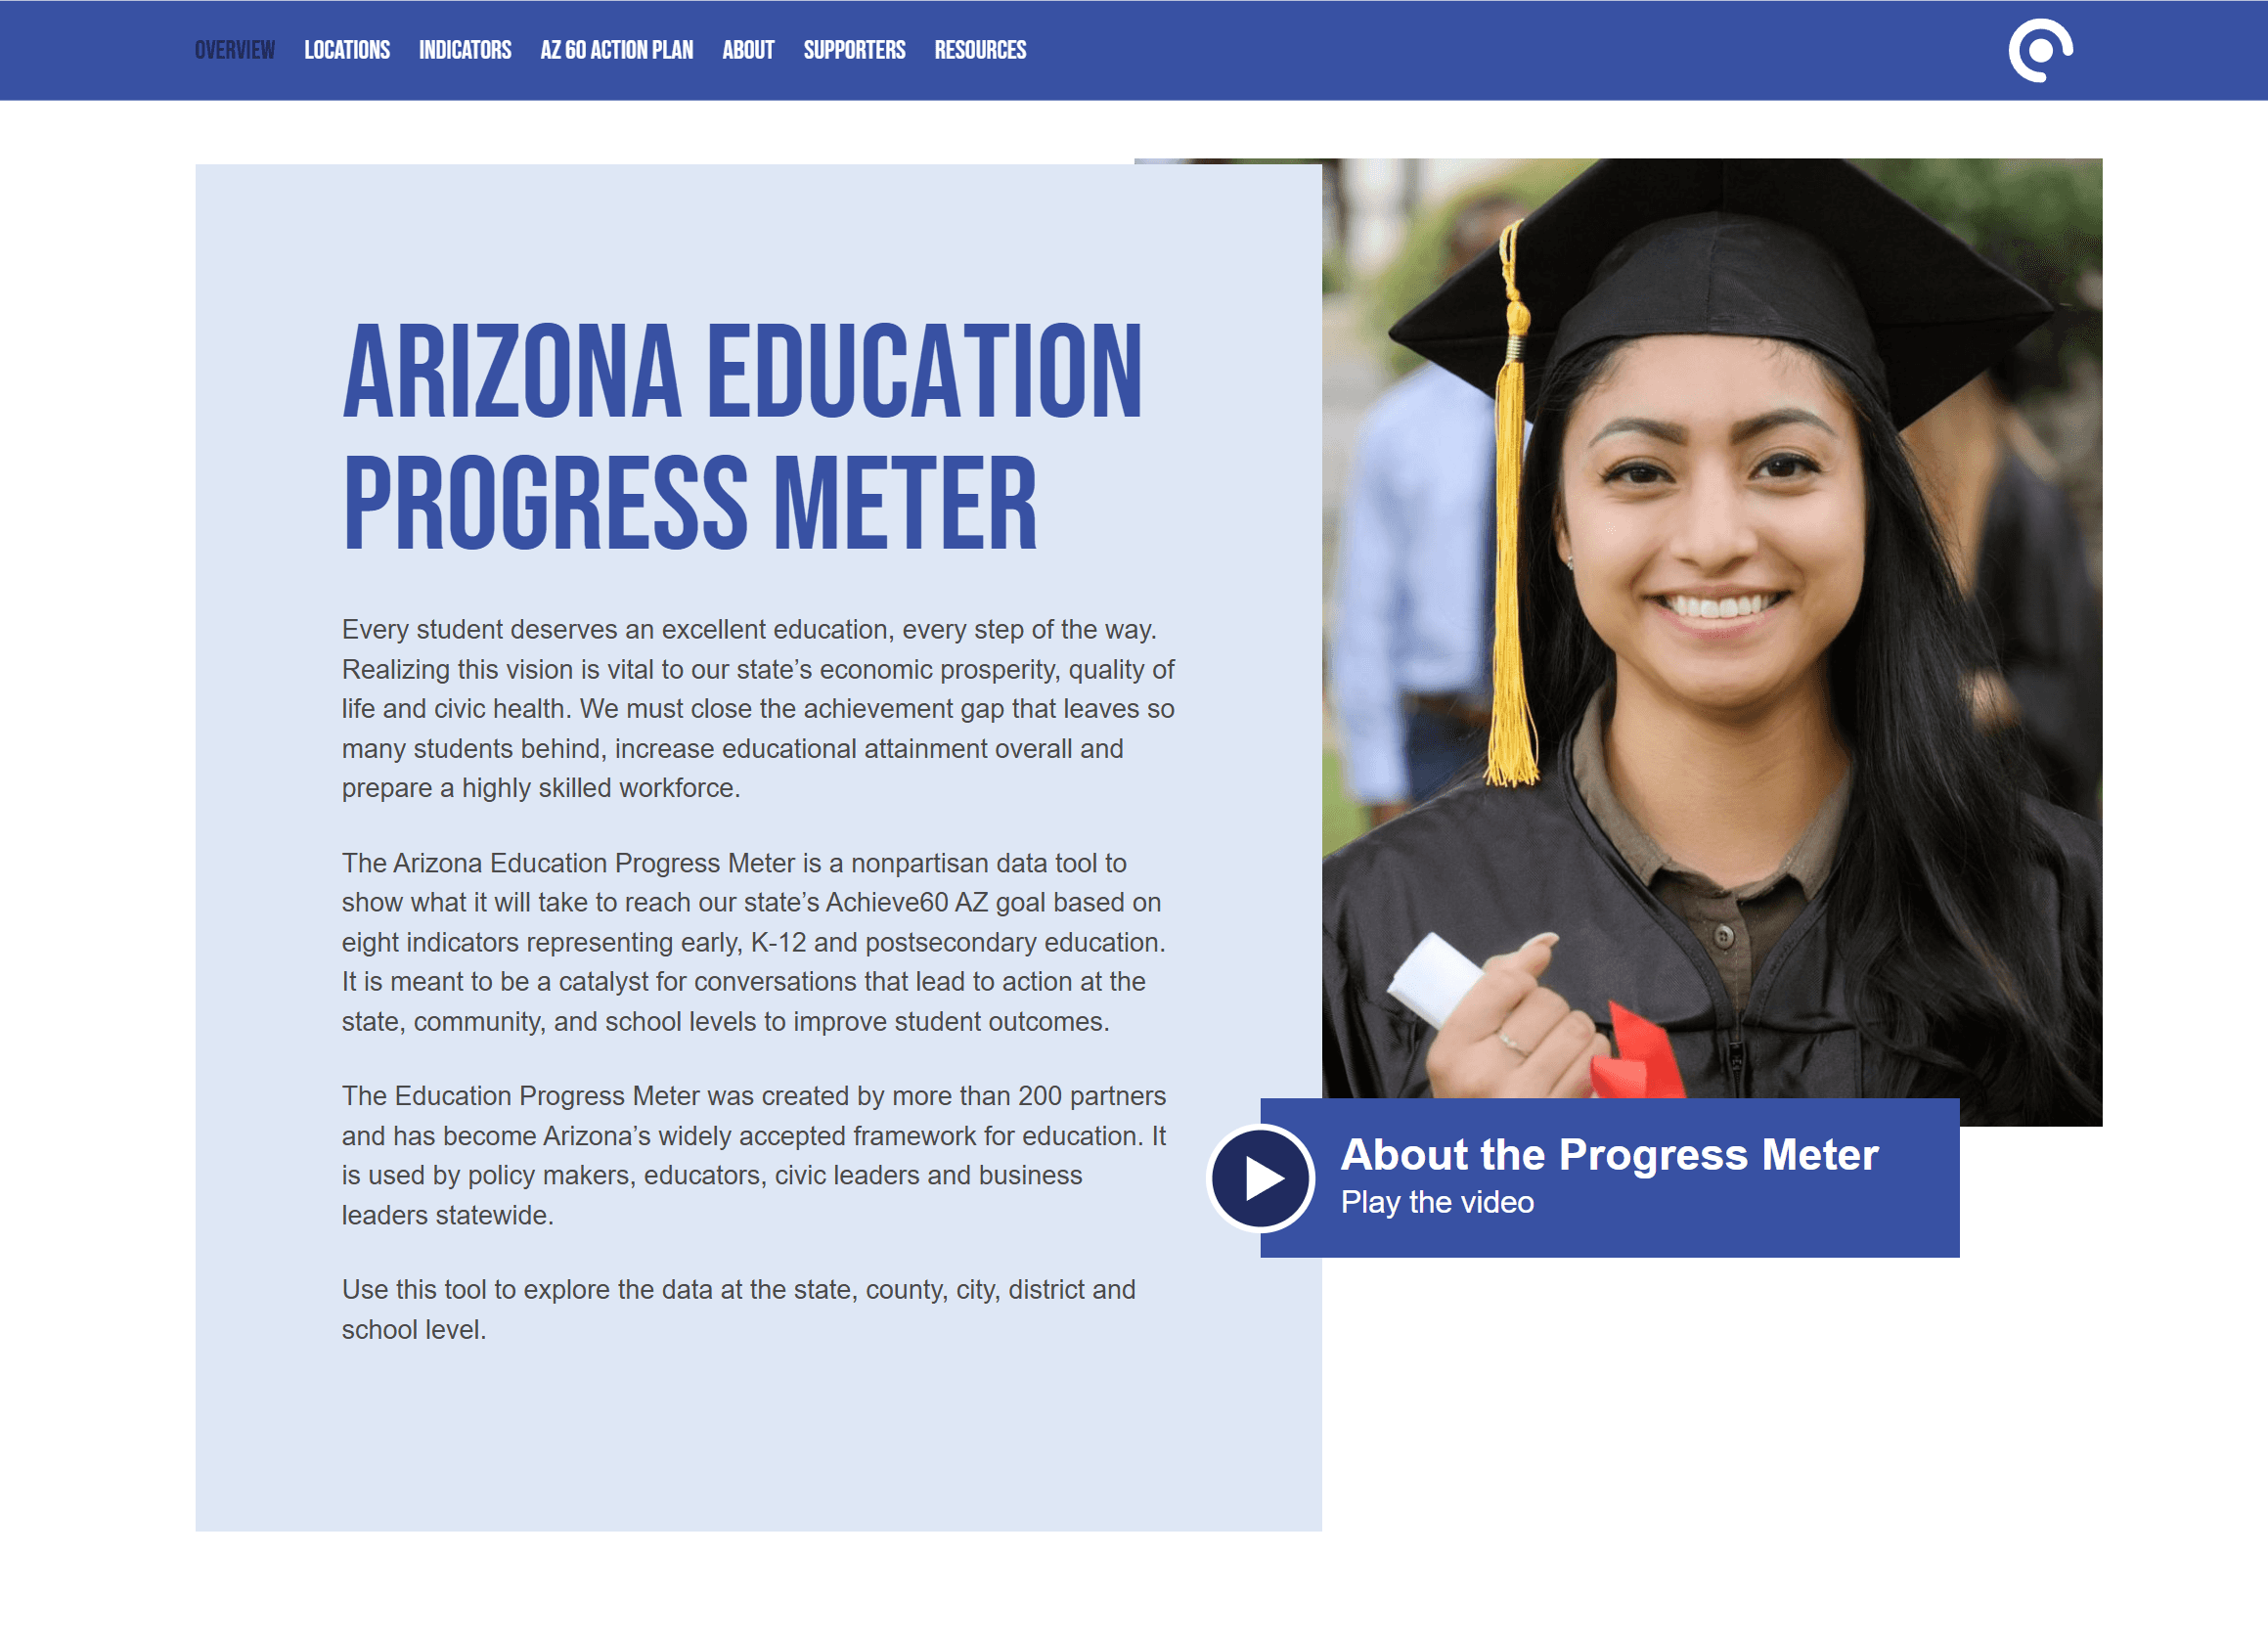
Education Forward Arizona
This online tool organizes vast educational data, visualizing it in easily digestible graphics, allowing users to explore metrics by location and over time.
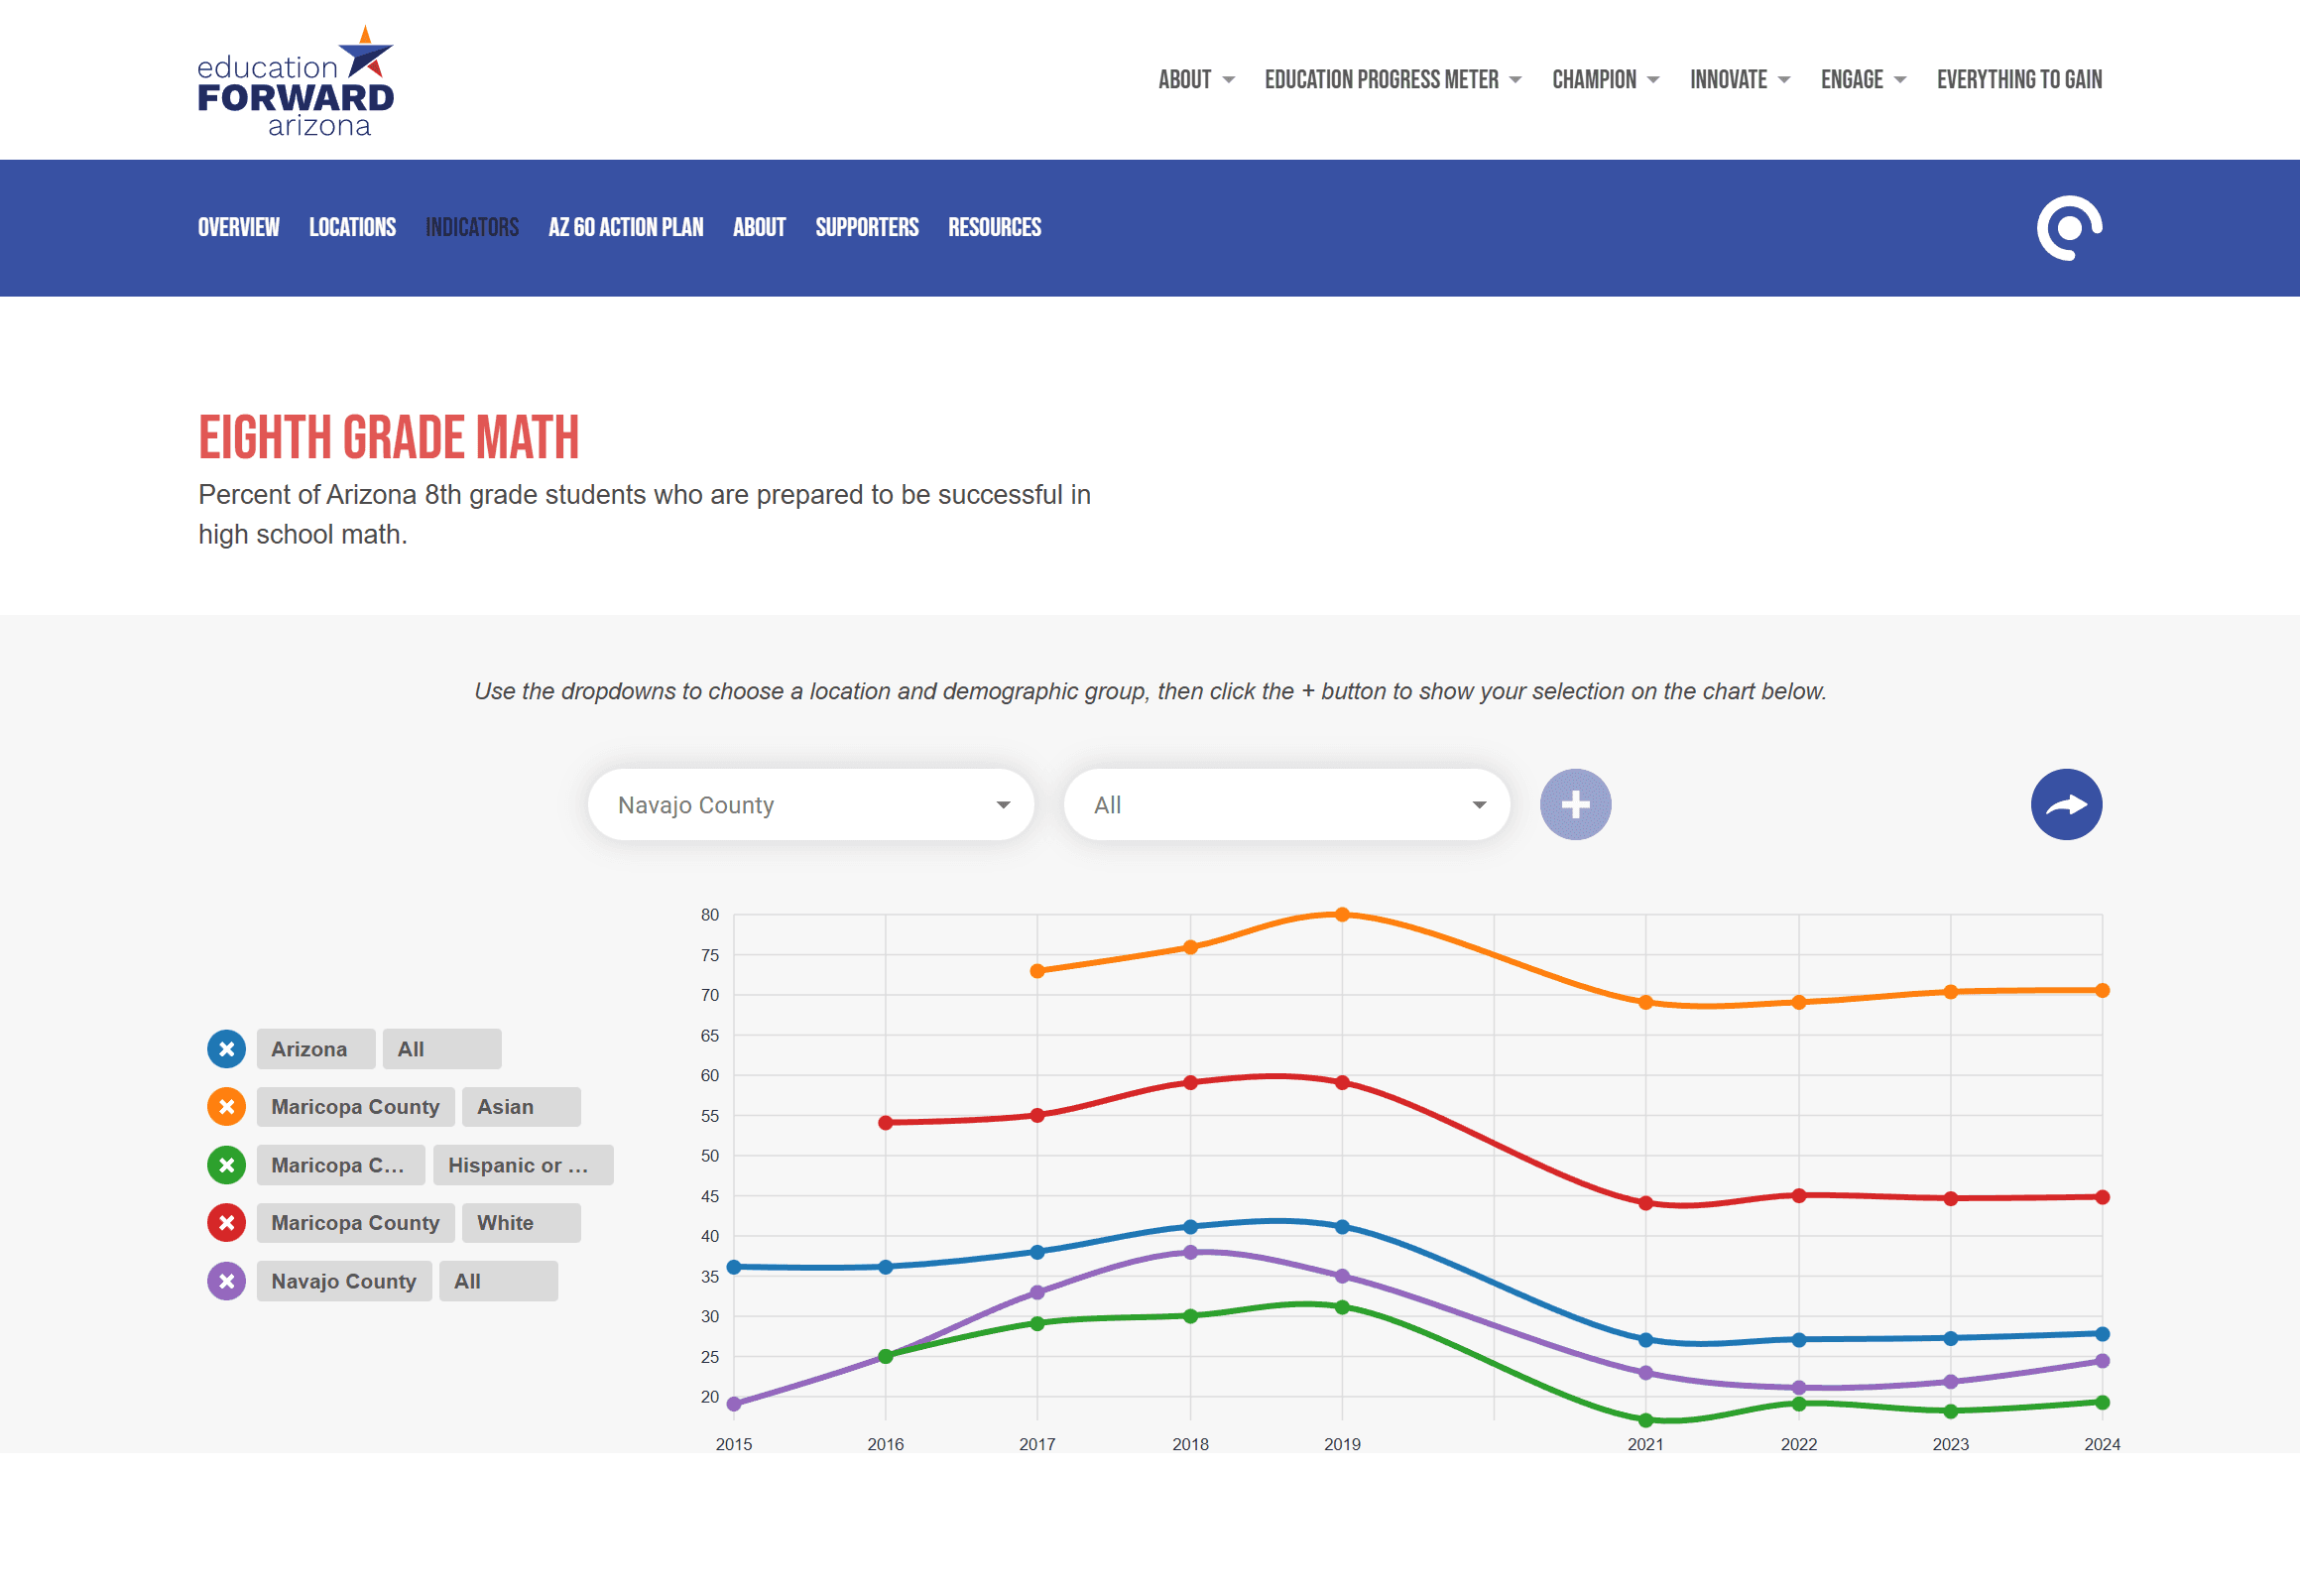
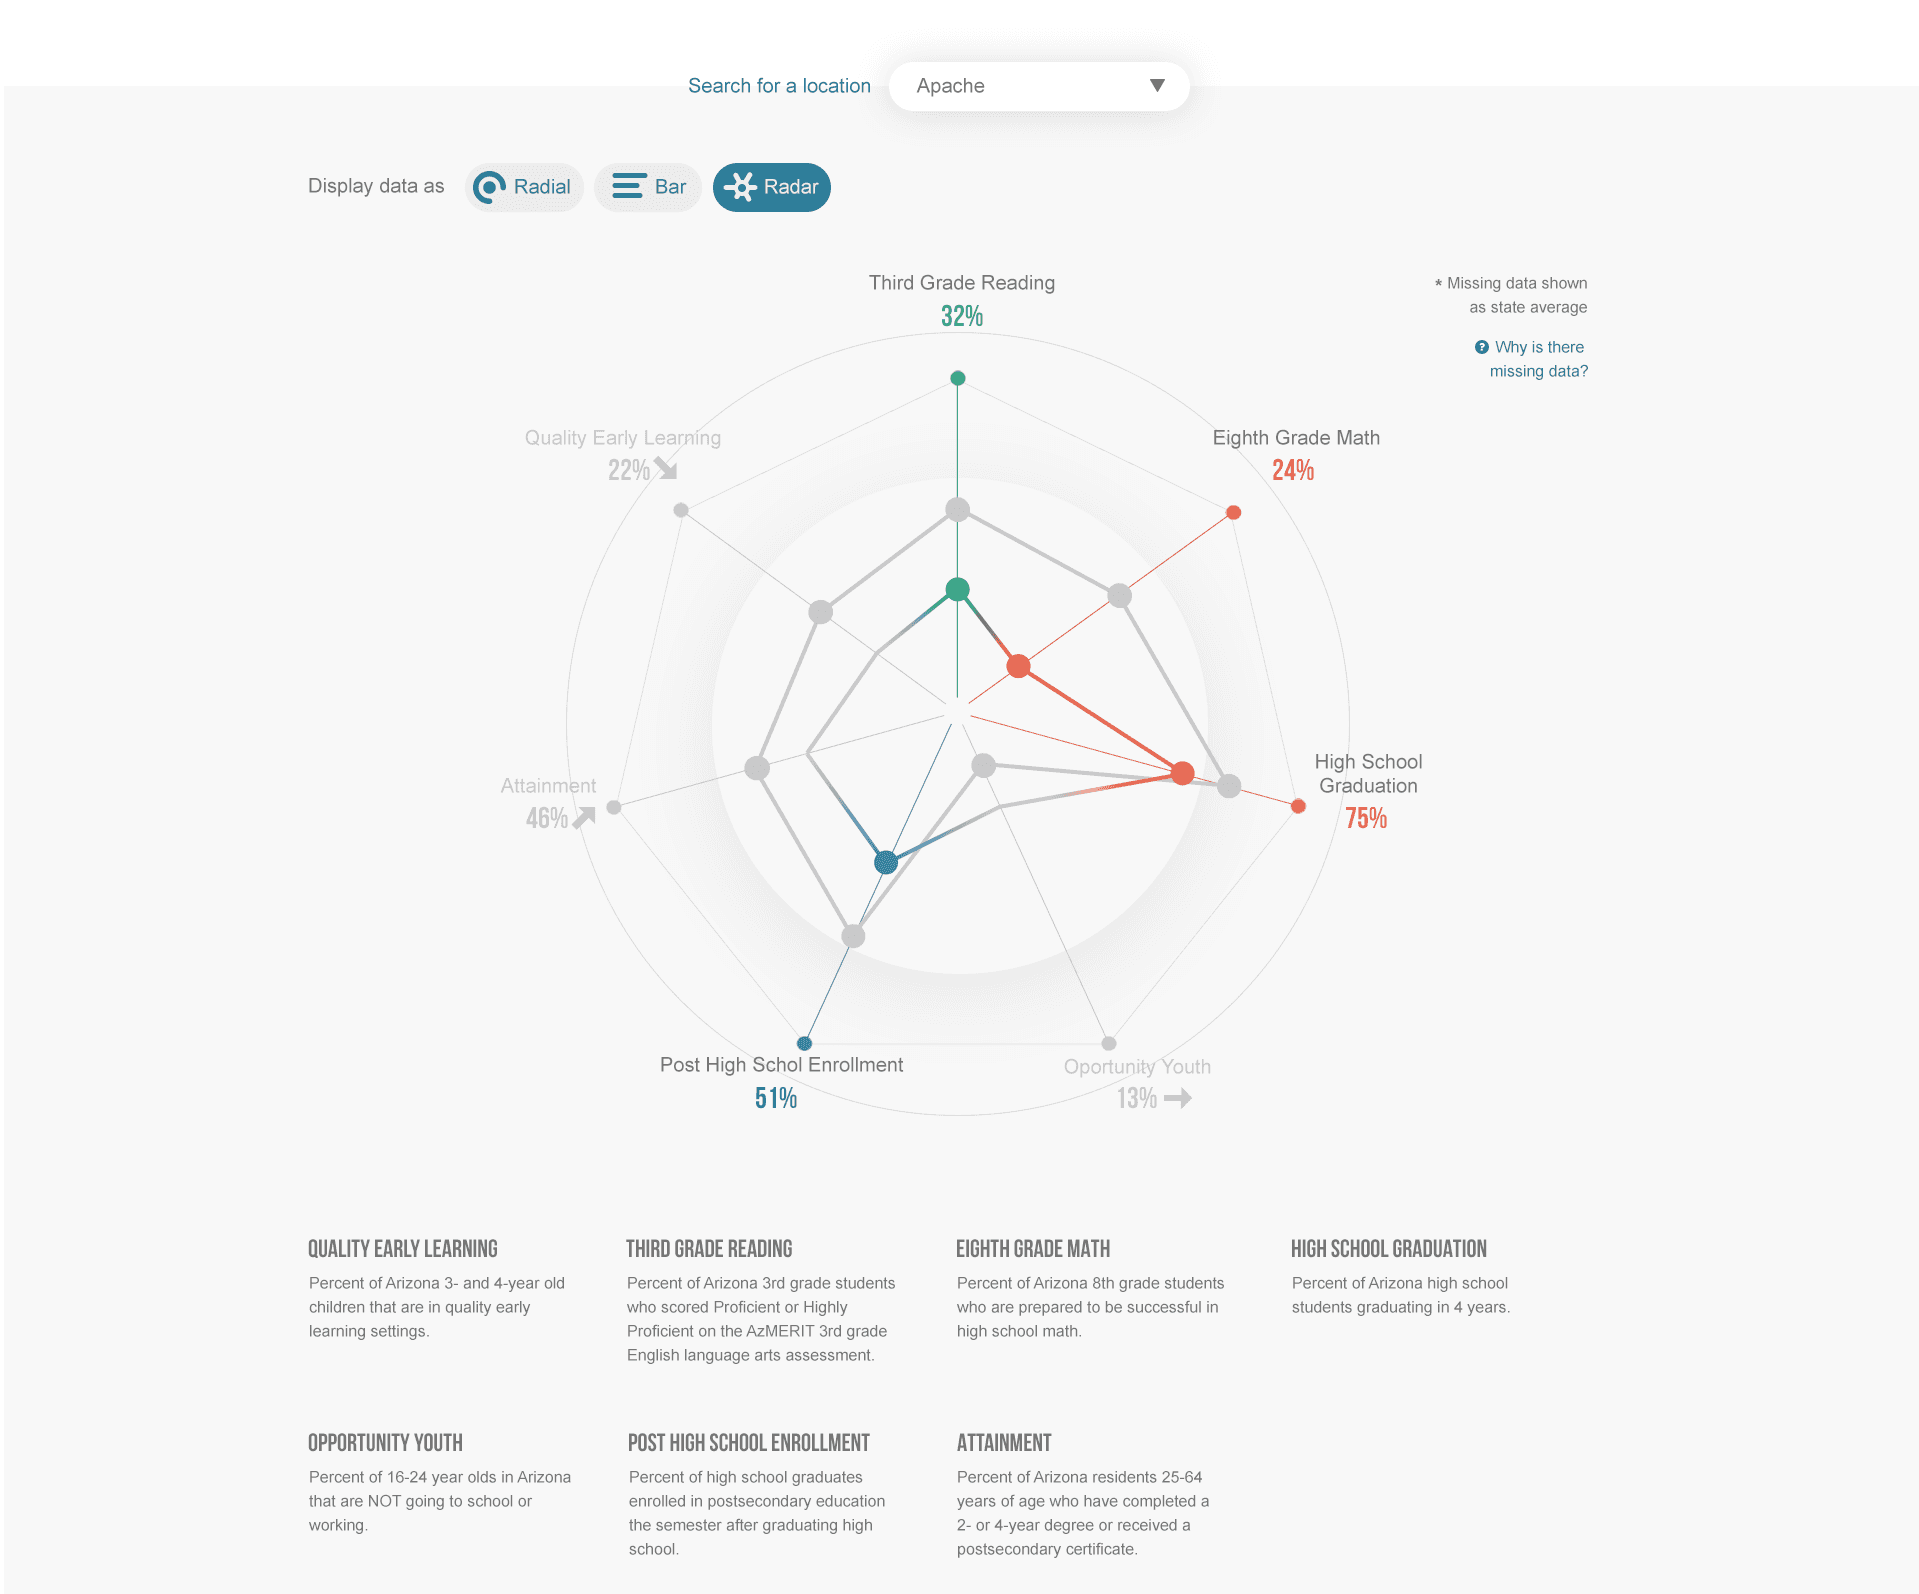
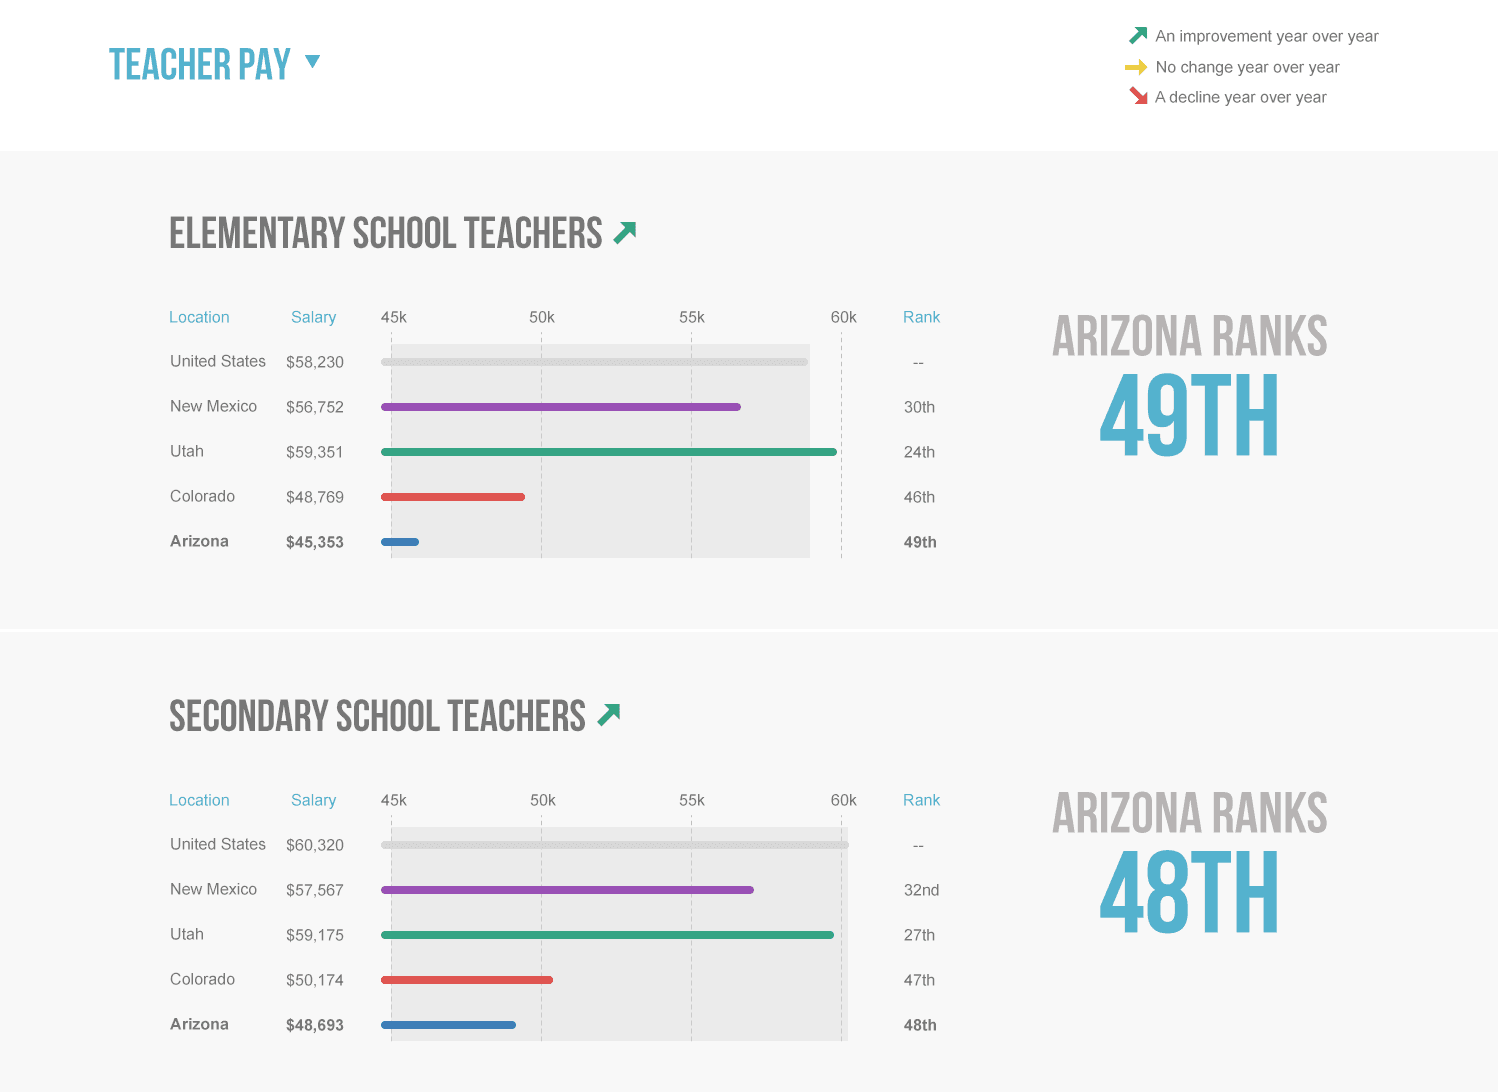
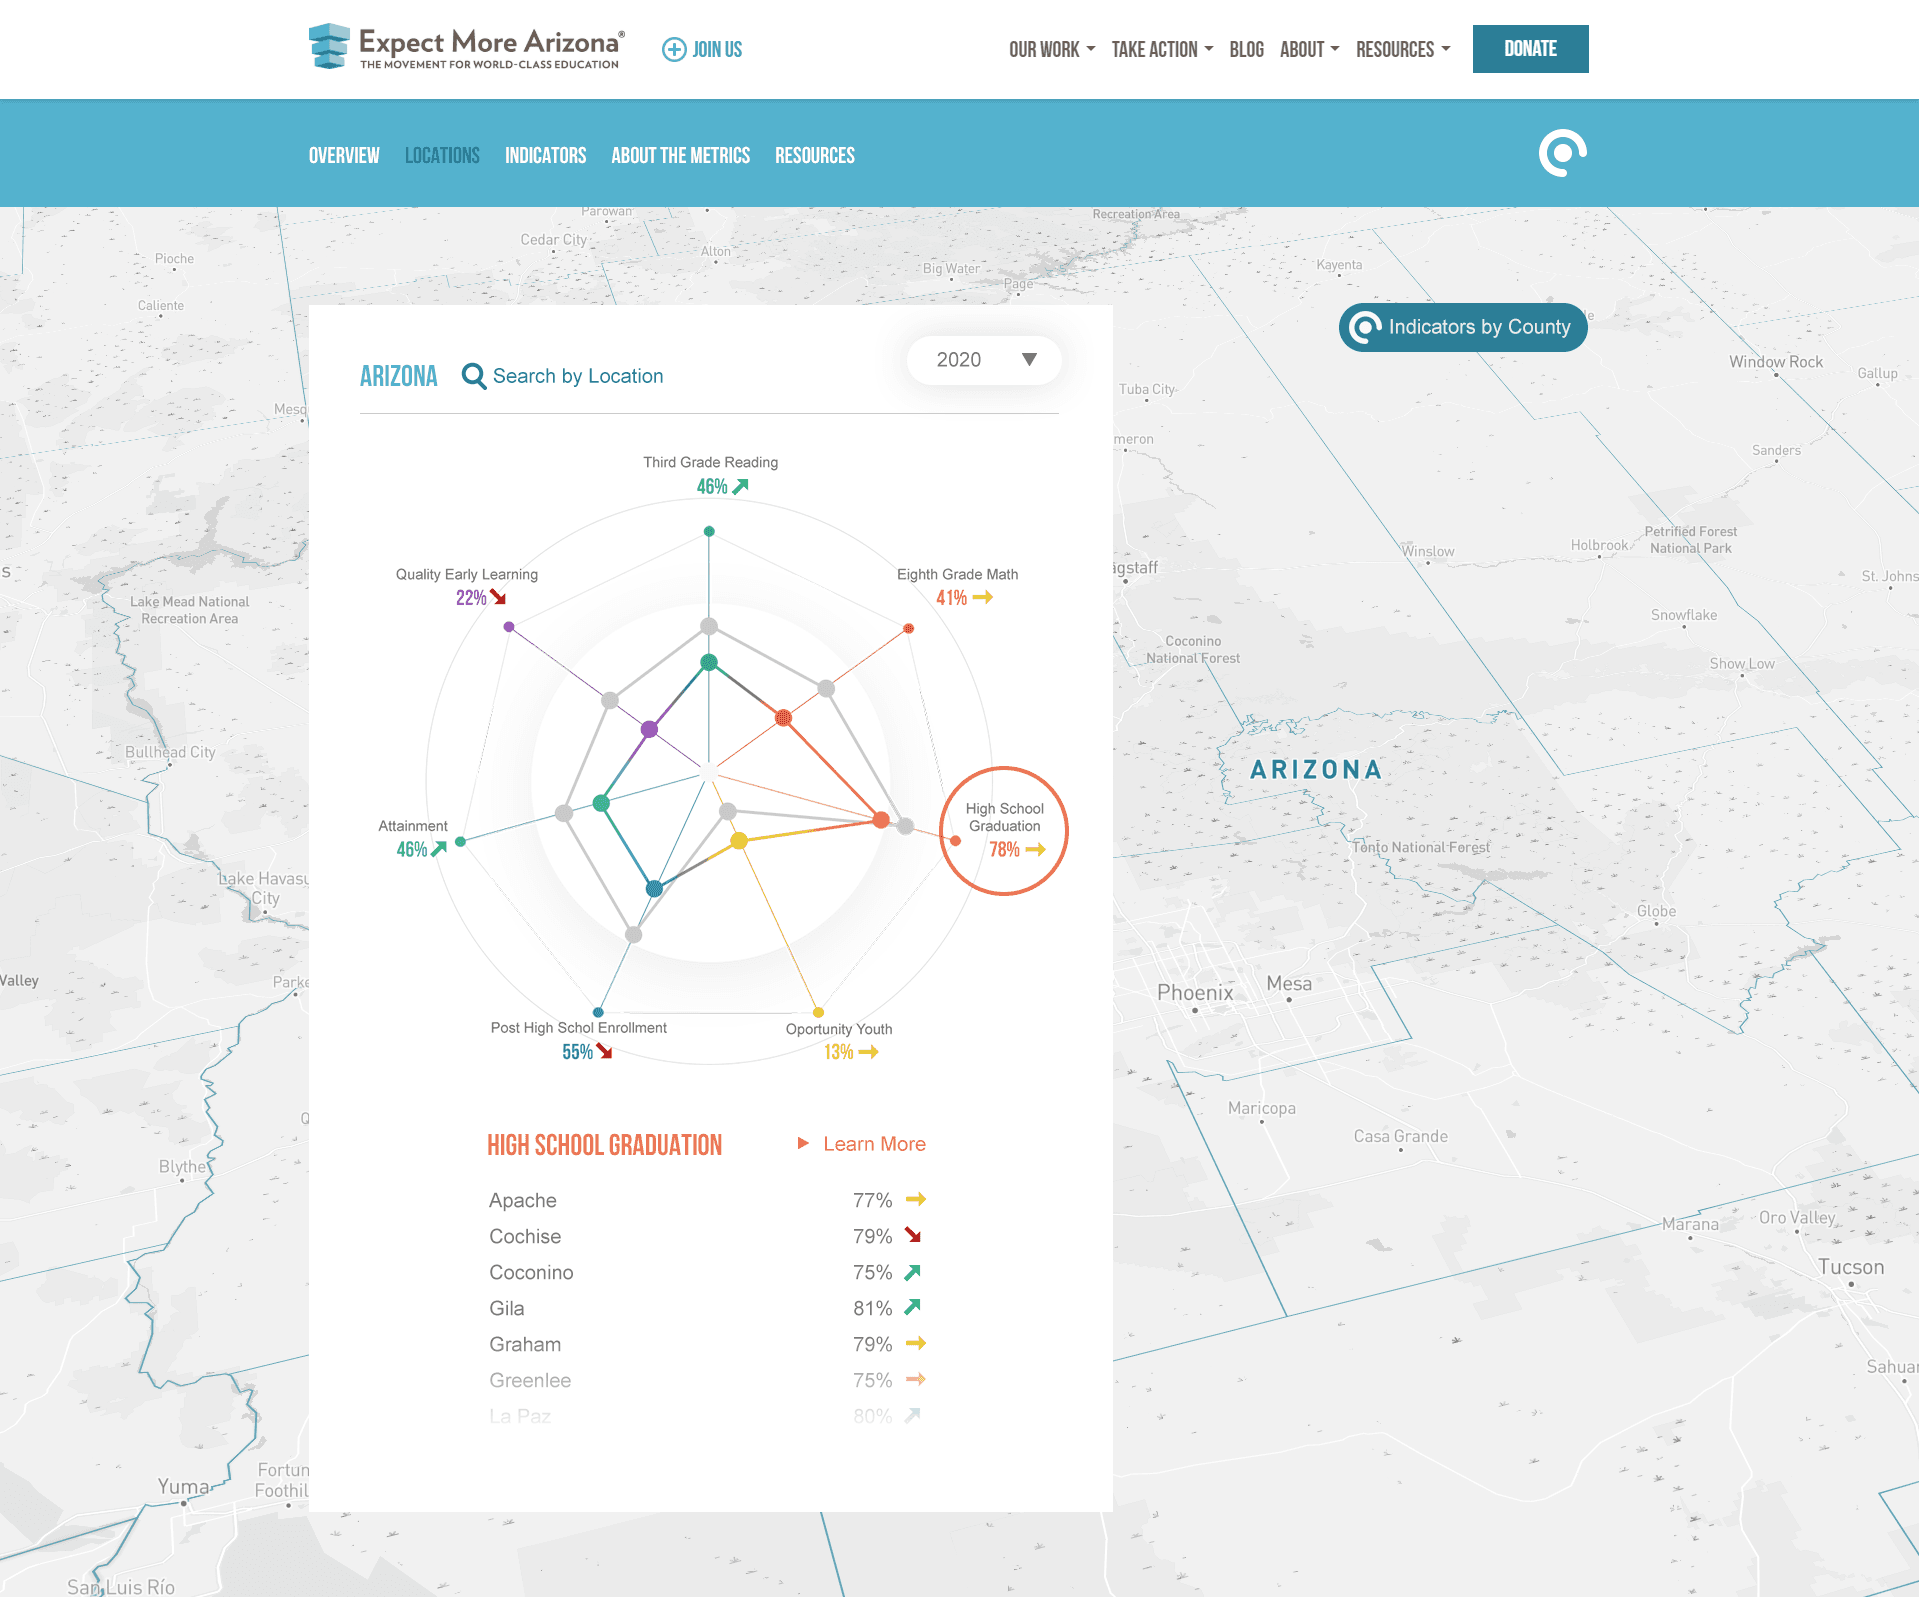
During the design phase of the project, we explored a variety of approaches to determine the most effective way to display the data. We developed radar graphs, bar charts, line graphs, and radial diagrams with visual continuity in mind, enabling users to seamlessly toggle between chart types and view the data in their preferred format.
The site's design is clean and dynamic, with pops of unexpected and gratifying interactions.
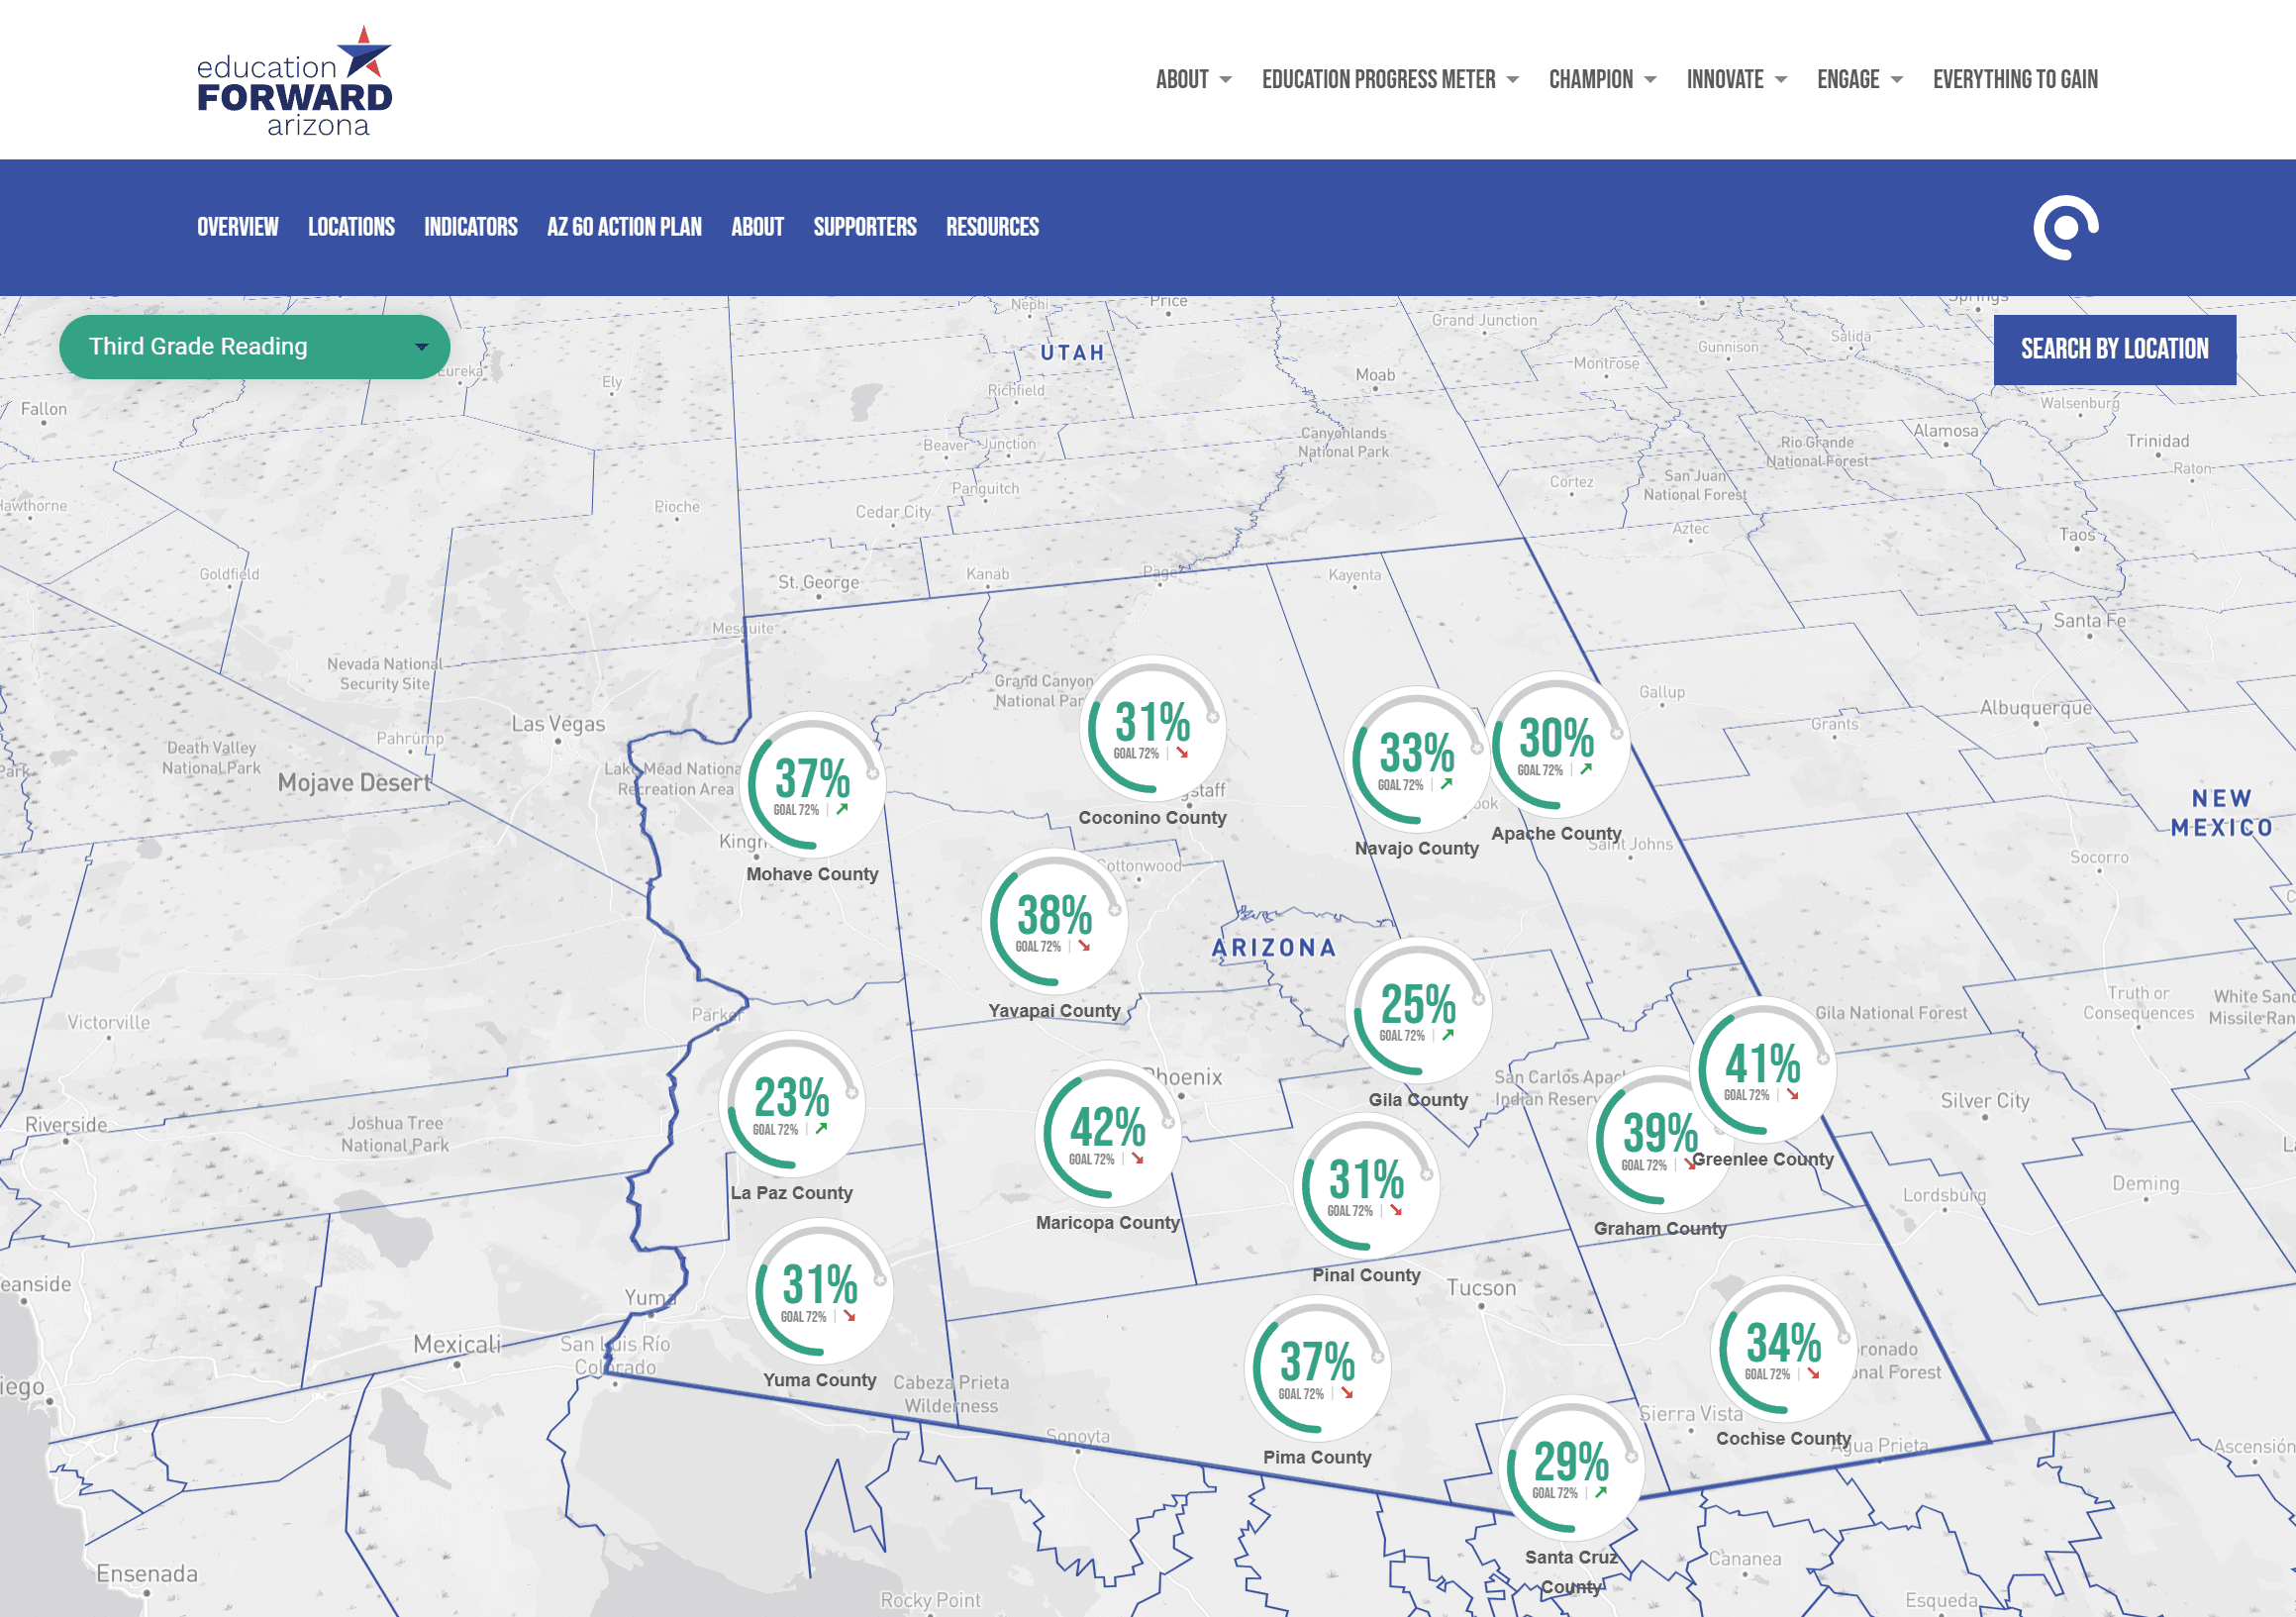
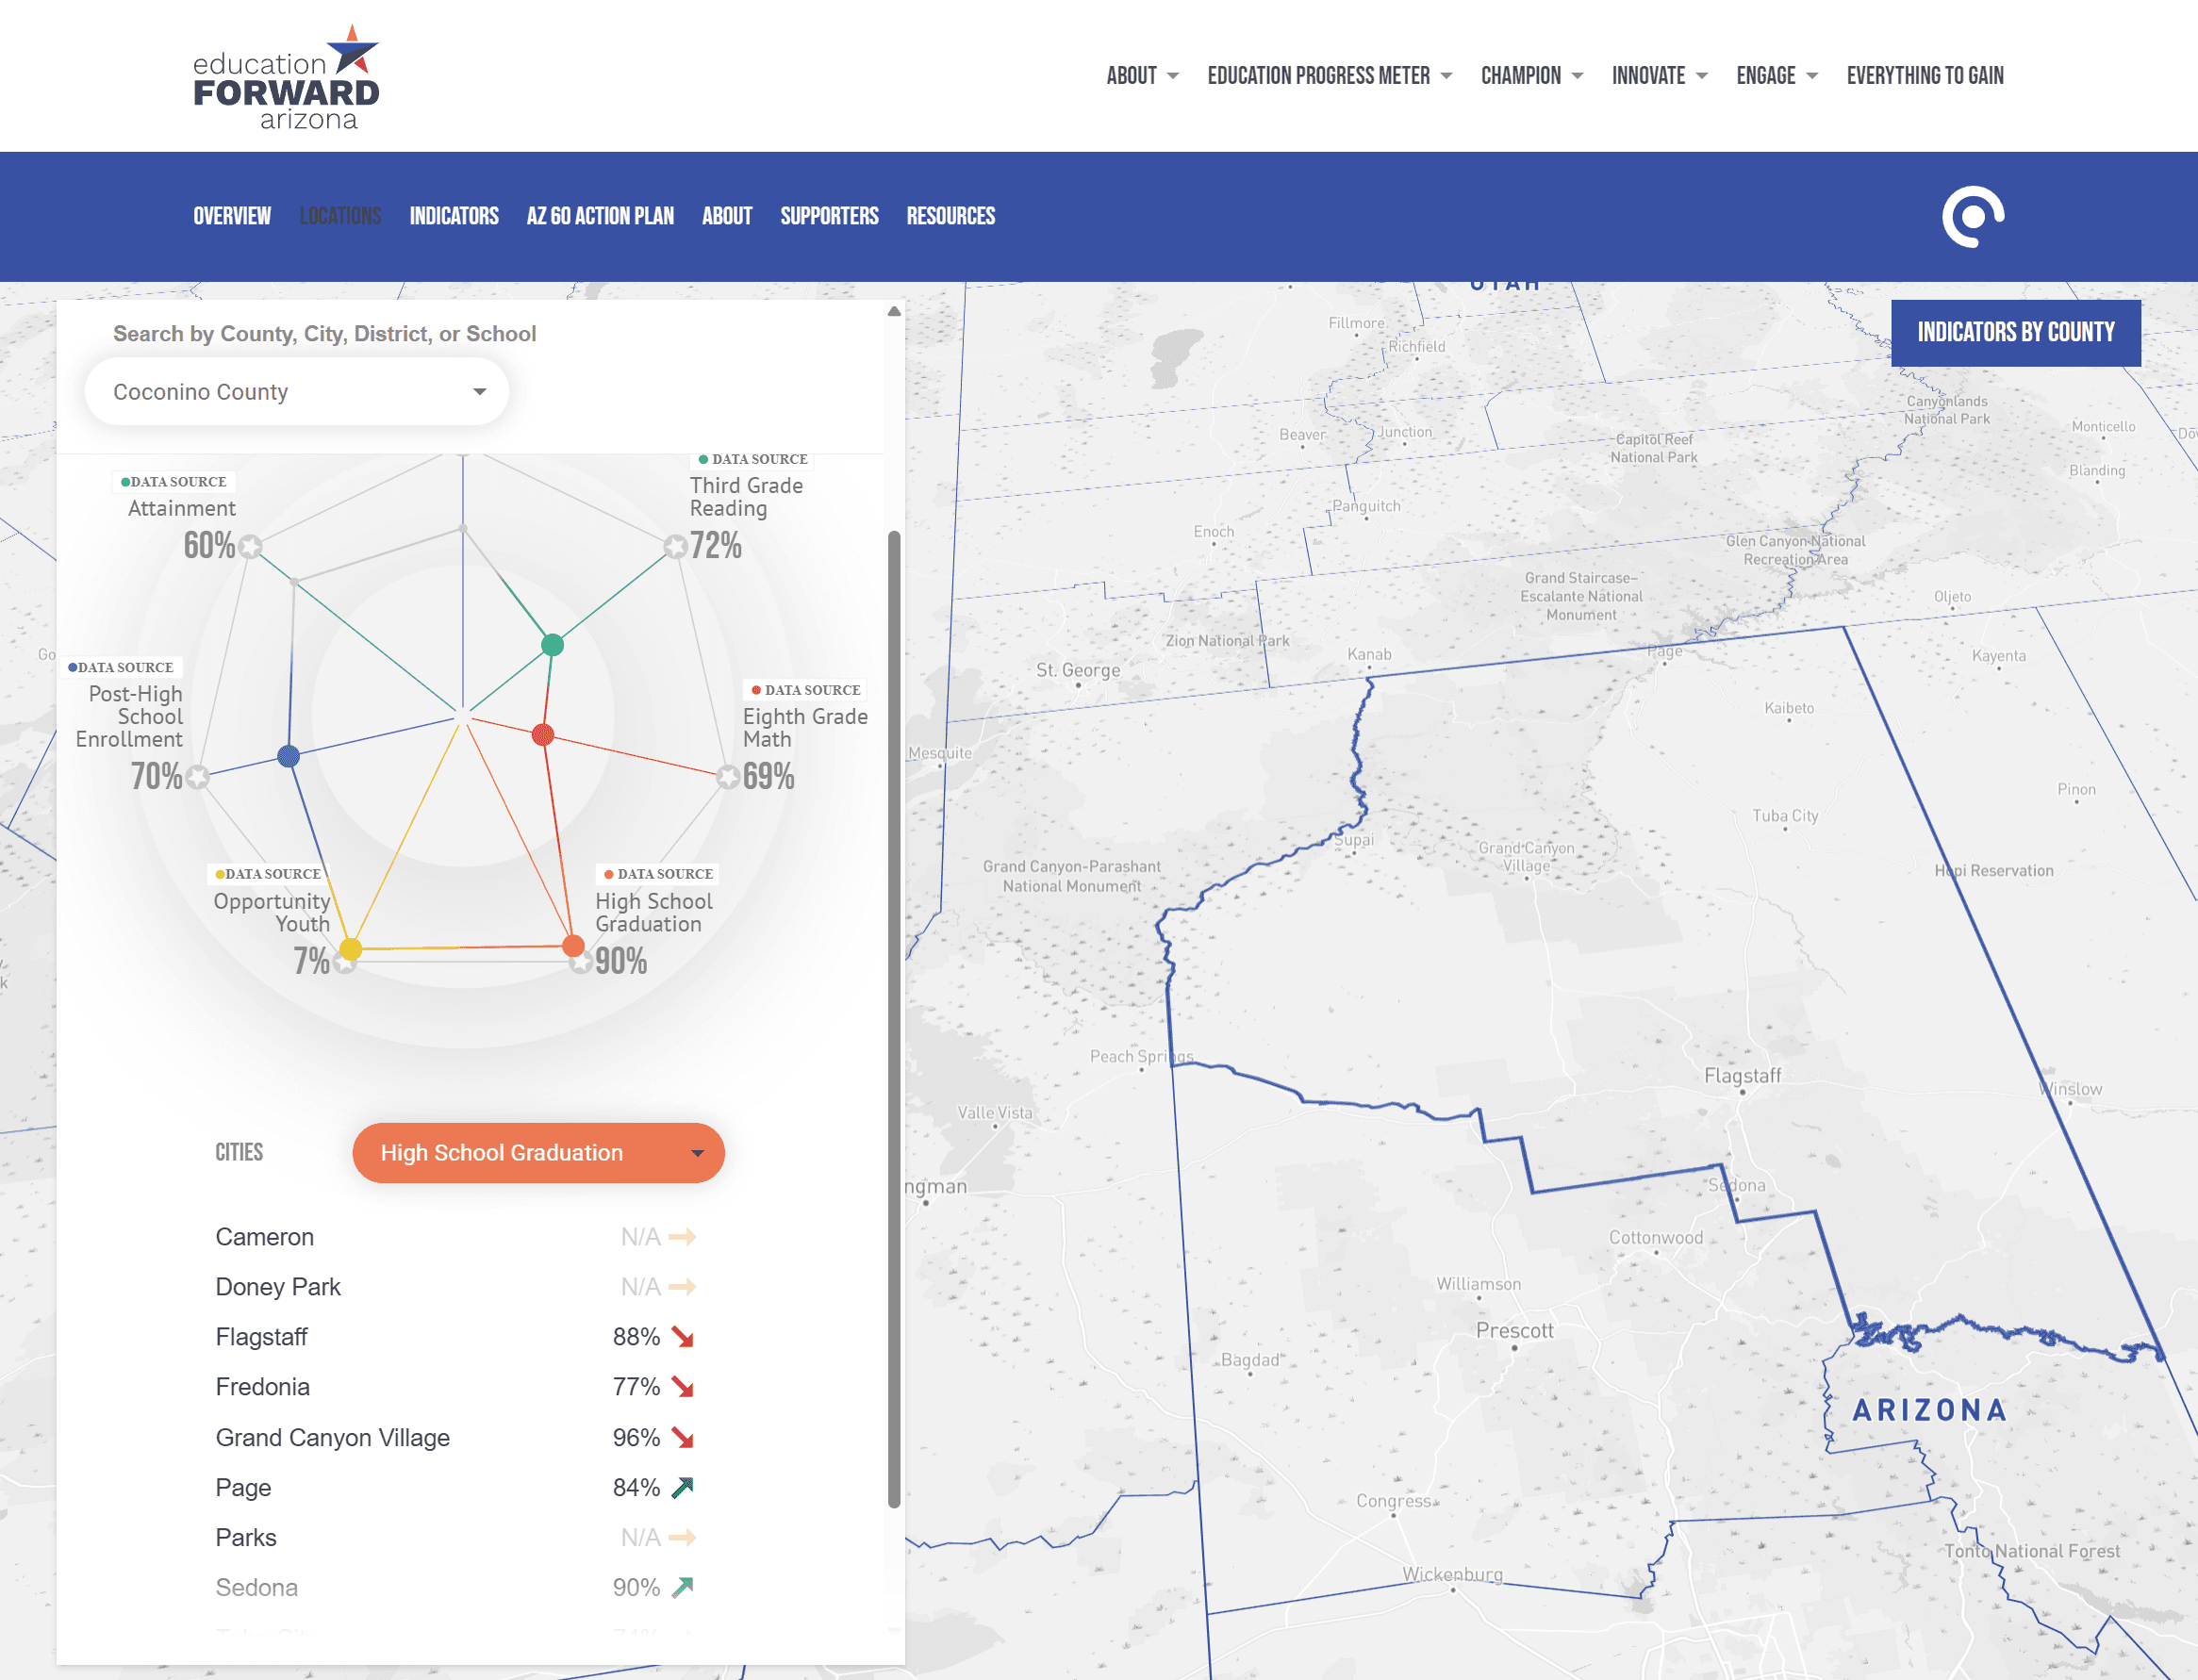
A custom map view allows users to explore data by county, city, or individual school. We designed and developed an intuitive interface that provides immediate feedback, helping users quickly identify which locations are performing well, improving, or may require additional attention.